Dashboard Map
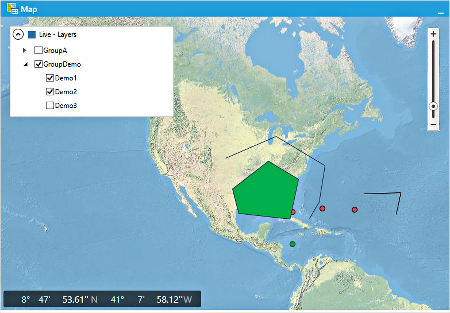
The Map panel in the Dataflow dashboard shows a map containing the layers and objects that have been added to maps in individual Dataflow documents. This map cannot be edited; you can only show or hide layers, and refresh the map after changes have been made in documents. For more information about working with maps in documents, see Maps.
Important: The Dashboard Map has a display limit for map objects; this is set to ensure that map rendering times are not excessive. POINT and POLYGON objects have a count of 1 with respect to this display limit, however LINESTRING objects are counted by the number of line pairs that are contained (e.g., a LINESTRING containing 10 points will be counted as 9 map objects); closed LINESTRING objects (i.e., starting and ending at the same point) can be substituted with POLYGON objects. The display limit has a default value of 500 objects, which can be modified by IPS Administrators using the Dataflow application setting 'Maximum Dashboard MapItems To Display', with an upper limit of 10000 objects.
Note: Objects imported from shapefiles are not shown on the Dashboard Map.

Map Layer Tags are used to organize the contents of the Dashboard Map, and to control the style of how map data objects will be displayed. Only layers that have at least one Map Layer Tag applied will be shown in the Dashboard Map, and only if the tag is a member of a Map Layer Tag Group.
Furthermore, the tags can set layers to be made visible at different zoom levels, and to set the styling (color, pattern, etc) of the appearance of map objects in each layer. Map layer tags are created and edited in the Dataflow Configuration workspace (see Tags).
Map layer tag permissions control whether a user will be able to see a layer in the Dashboard Map; 'Read' permission must be granted, otherwise the layer will not be visible to the user.
Map layer tags are grouped using the Dashboard Map screen in the Dataflow Configuration workspace (see Dashboard Map configuration (Map Layer Tag groups)). Using the check boxes for groups of tags in the map legend, you can easily show or hide map information that is related.
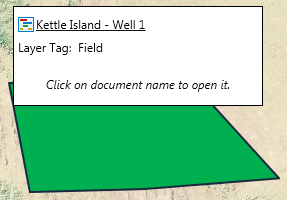
If you click an object, the name of its document will appear above it, as shown below. Click the name to open that document. The document will also be selected in the hierarchy.

Map view settings are saved, so the map view that is set when you close the Dashboard will be the same when you open the Dashboard next time.
